Radiologist Salary in Montebello, CA: $495,210 (2026)
Quick Answer:A full-time radiologist in Montebello, CA earns a median $495,210/year (≈ $238.08/hour) in nominal terms for 2026 — projected from BLS OEWS 2025 (SOC 29-1224). Once you factor in Montebello's price level (13% above national, BEA RPP 113.1), that paycheck buys what $437,851 would nationally. Nominal pay sits 0.9% below the California state average.
Based on BLS state-level estimates · View source
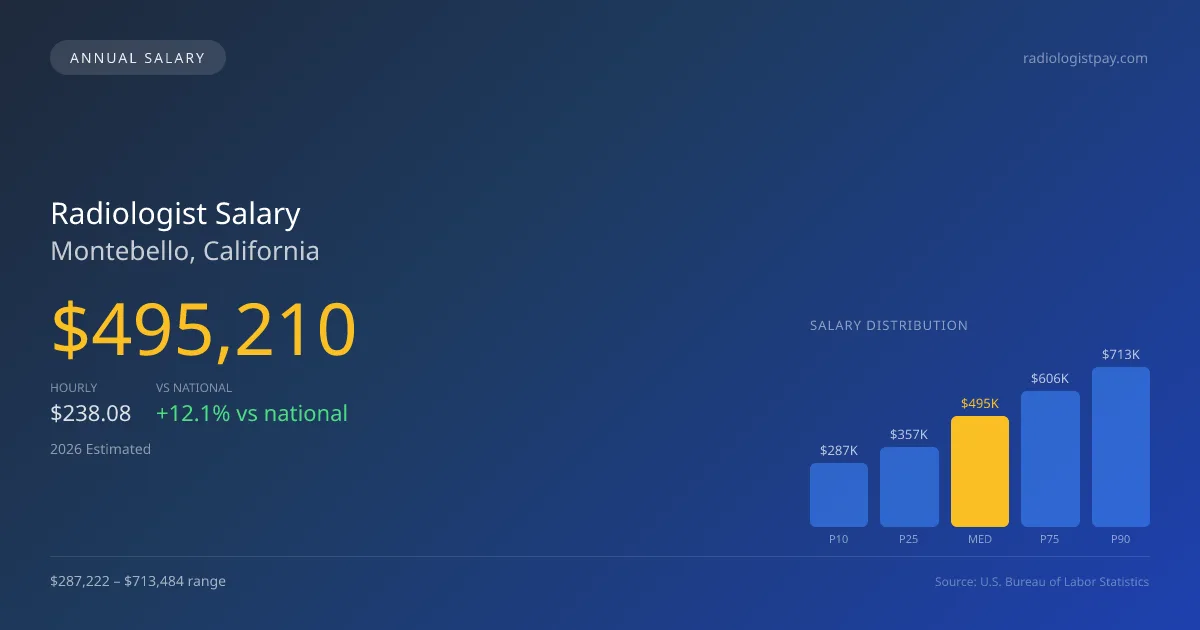
In Montebello, California, radiologists can expect a median annual salary of $495,210 in 2026, reflecting a notable 12.06% increase compared to national averages. The salary range for radiologists in the area spans from $287,222 at the 10th percentile to $713,484 at the 90th percentile, allowing for significant variations based on factors such as subspecialty focus. With the local market comprising different subspecialties, including interventional radiology (IR) and general diagnostic radiology, income potential will significantly vary. These figures are based on 2025 BLS data projected to 2026, indicating that Montebello presents a competitive salary landscape for radiologists amid evolving healthcare dynamics.
About the Montebello Market
Salary estimated from California average ($450,000) adjusted for local cost of living.
Salary Breakdown
| Percentile | Annual | Hourly |
|---|---|---|
| Entry Level (P10) | $287,222 | $138.09 |
| Lower Range (P25) | $356,552 | $171.42 |
| Median (P50)(typical) | $495,210 | $238.08 |
| Upper Range (P75) | $606,029 | $291.36 |
| Top Earners (P90) | $713,484 | $343.02 |
Median Salary Position
12.06% above the national average
2026 Salary Percentile Distribution in Montebello
In Montebello, CA, the radiologist salary spread from the 10th to 90th percentile is $426,262 (2026 est.). At $495,210, the local median is 12.06% above the national median of $441,903.
Salary Calculator
At 40 hours/week in Montebello: You'd be in the lower-middle range
How Montebello Radiologist Pay Compares
Montebello median: $495,210/year (2026)
| Compared To | Median Salary | Montebello Pays |
|---|---|---|
| California Average | $499,708 | -0.90% less |
| National Average | $441,903 | +12.06% more |
Radiologists in Montebello, CA earn a median of $495,210 per year (2026 est.), which is 12.06% higher than the national median of $441,903 and 0.90% below the California state average of $499,708.
Cost-of-Living Adjusted Salary
Montebello has a cost of living 13.10% above the national average.
Adjusted salary = nominal × (100 / CoL index). CoL index: 100 = national average.
Montebello, CA has a cost-of-living index of 113.1 (above the national average of 100). While the nominal salary of $495,210 is competitive, the higher cost of living reduces purchasing power to an effective $437,851 — a 11.58% reduction.
Compare Purchasing Power
Select a city to see how your salary compares after cost of living
Select a city above to compare purchasing power
2021 BLS Actual
$388,010
2025 BLS Actual
$471,629
2026 Current Est.
$495,210
2021–2027 Growth
+34.0%
Salary Trajectory for Radiologists in Montebello (2021–2027)
2021–2025: actual BLS OEWS data for this metro area. 2026+: CAGR 5.00% projection.
| Year | Annual Salary | Status |
|---|---|---|
| 2021 | $388,010 | Actual |
| 2022 | $407,411 | Actual |
| 2023 | $427,781 | Actual |
| 2024 | $504,284 | Actual |
| 2025 | $471,629 | Actual |
| 2026(current) | $495,210 | Estimated |
| 2027 | $519,971 | Projected |
Based on 5 years of BLS OEWS data for the Montebello metropolitan area, the median radiologist salary grew 21.6% from $388,010 (2021) to $471,629 (2025). At a 5.00% compound annual growth rate, salaries are projected to reach $519,971 by 2027 — a total increase of $131,961 (34.01%) from 2021.
Note: Historical values (2021–2025) are actual BLS OEWS figures for the Montebello metropolitan area, sourced from annual Occupational Employment and Wage Statistics surveys. 2026–2026 figures are current estimates, and 2027 values are projections, calculated using a 5.00% CAGR derived from 5-year BLS historical data. Actual salaries may vary based on employer, experience, certifications, and local market conditions.
Salary by Experience Level
| Experience | Estimated Salary Range |
|---|---|
| 0-2 years (New Graduate) | $287,222 – $356,552 |
| 3-5 years (Mid Career) | $356,552 – $495,210 |
| 5+ years (Experienced) | $495,210 – $606,029 |
| 10+ years (Top Earner) | $606,029 – $713,484 |
MD, DO salary ranges estimated from BLS percentile data. Individual radiologist compensation varies by employer, certifications, and specialization.
Radiologist Job Market in Montebello
The job market in Montebello shows a healthy presence of 16 employed radiologists, suggesting a stable demand for specialists in this field. With a cost-of-living index of 113.1, the purchasing power of radiologists is slightly above the national average, which should inform salary negotiations and job choices. Local employers span a mix, with private radiology practices generally offering the highest compensation opportunities, often linked to partnership equity stakes and revenue-based productivity (RVU models). Organizations such as hospital systems and teleradiology firms provide alternative models, with varying levels of financial incentives based on night call coverage and other factors. Radiologists can enhance their earnings by focusing on high-demand subspecialties, engaging in private practice, or exploring hybrid arrangements that capitalize on both hospital employment and potential teleradiology income streams.
More salary data for Montebello, CA:
Frequently Asked Questions
How much do radiologists make in Montebello, CA in 2026?
Is Montebello, CA a good place to work as a radiologist?
Can radiologists make $100K in Montebello?
What is the cost-of-living adjusted radiologist salary in Montebello?
How much does a radiologist make per hour in Montebello?
Related Pages
Compare Salaries
Career Resources
Nearby Cities in California
Written by Dr. Maria Chen, MD
Career Analyst
Dr. Chen has 10 years of experience in diagnostic radiology. She specializes in imaging techniques for oncology. She works at a regional medical center.
Methodology & Data Source
Salary figures on this page are 2026 projections based on the Bureau of Labor Statistics Occupational Employment and Wage Statistics (OEWS) survey, May 2026 release. The BLS reported a median annual salary of $471,629 for radiologistsin the Montebello metropolitan area. A 5.00% compound annual growth rate (CAGR), calculated from 6-year national BLS wage trends, was applied to project current 2026 compensation. Percentile ranges (P10–P90) represent the full salary distribution across experience levels and practice settings in this market.
Data Sources & Methodology
Salary data for Montebello is estimated from official BLS state-level occupational wage data (2025), adjusted for regional cost-of-living differences using BEA RPP (Regional Price Parities).
2026 figures are projected from 2025 BLS data using a compound annual growth rate (CAGR) of 5.00%, derived from historical BLS wage trends for radiologists (SOC 29-1224).
Compiled and verified by Dr. Maria Chen, MD, a licensed radiologist with 10+ years of clinical experience. · View source data at BLS.gov