Radiologist Salary in Michigan: $390,415 (2026)
Quick Answer:Across Michigan's 52 metropolitan areas, the average median radiologist pay sits at $390,415/year heading into 2026 — a figure projected from 2025 BLS OEWS wage data for SOC 29-1224. Because Michigan sits at BEA RPP 93.2 (7% below the U.S. baseline), that statewide median translates to roughly $418,900 in nationally-comparable purchasing power. Highest-paying metros: Detroit ($420,012), Clinton Township ($405,561), Sterling Heights ($400,459).
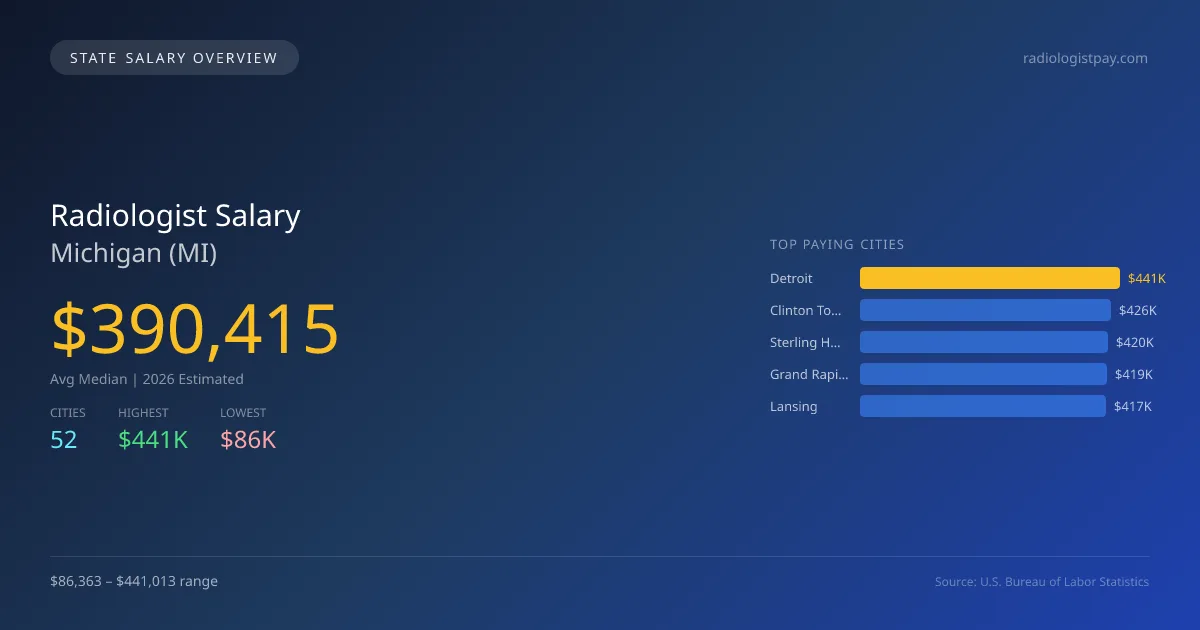
In Michigan, the average median salary for radiologists in 2026 is projected to be $390,415, which is 11.7% lower than the national median of $441,903. The disparity in compensation across cities is significant, with Detroit offering the highest salary at $441,013 compared to Ann Arbor's lowest at $86,363. This dramatic difference of $354,650 can be attributed to factors such as local demand for healthcare services, cost of living, and the presence of major medical institutions in urban areas compared to smaller cities. Michigan's regulatory environment includes specific state licensing requirements that may influence salary levels, along with scope of practice laws that ensure radiologists can perform a wide range of responsibilities. The demand for radiologists is expected to grow by an annual rate of 5.00%, indicating a healthy job market outlook for the profession. Key metropolitan areas such as Clinton Township, Sterling Heights, Grand Rapids, and Lansing follow Detroit with salaries ranging from $417,054 to $425,839, reflecting their respective healthcare demands and economic conditions. Overall, while radiologist salaries in Michigan may lag behind national averages, the steady growth in the field suggests continued opportunities for professionals in the state.
Michigan Radiologist Salary Range
Overall salary range in Michigan: $86,363 (lowest entry-level) to $658,499 (highest top earner)
Michigan vs National Average
Michigan radiologists earn 11.65% less than the national median ($-51,488/year difference).
Michigan Radiologist Salary Distribution (2026)
Radiologist salaries in Michigan range from $229,089 (entry-level, 10th percentile) to $554,815 (top earners, 90th percentile), with a median of $390,415. The Michigan median is $51,488 below the US national median of $441,903. The average hourly rate is $187.70/hr. Approximately 822 radiologists are employed across 52 cities.
2021 BLS Actual
$305,901
2025 BLS Actual
$371,824
2026 Current Est.
$390,415
2021–2027 Growth
+34.0%
Salary Trajectory for Radiologists in Michigan (2021–2027)
2021–2025: actual BLS OEWS data for this metro area. 2026+: CAGR 5.00% projection.
| Year | Annual Salary | Status |
|---|---|---|
| 2021 | $305,901 | Actual |
| 2022 | $221,920 | Actual |
| 2023 | $337,256 | Actual |
| 2024 | $356,511 | Actual |
| 2025 | $371,824 | Actual |
| 2026(current) | $390,415 | Estimated |
| 2027 | $409,936 | Projected |
Based on 5 years of BLS OEWS data for the Michigan metropolitan area, the median radiologist salary grew 21.6% from $305,901 (2021) to $371,824 (2025). At a 5.00% compound annual growth rate, salaries are projected to reach $409,936 by 2027 — a total increase of $104,035 (34.01%) from 2021.
Note: Historical values (2021–2025) are actual BLS OEWS figures for the Michigan metropolitan area, sourced from annual Occupational Employment and Wage Statistics surveys. 2026–2026 figures are current estimates, and 2027 values are projections, calculated using a 5.00% CAGR derived from 5-year BLS historical data. Actual salaries may vary based on employer, experience, certifications, and local market conditions.
Top 5 Highest Paying Cities in Michigan
Lowest Paying Cities in Michigan
| City | Median Salary |
|---|---|
| Ann Arbor | $86,363 |
| Romulus | $380,871 |
| Ypsilanti | $383,070 |
| Mount Pleasant | $384,186 |
| Portage | $389,511 |
Best Value Cities for Radiologists in Michigan
When adjusted for local cost of living, these Michigan cities offer the most purchasing power for radiologists.
| City | Nominal Salary | CoL Index | Adjusted Salary |
|---|---|---|---|
| Detroit | $441,013 | 93.2 | $473,190 |
| Clinton Township | $425,839 | 93.2 | $456,909 |
| Sterling Heights | $420,482 | 93.2 | $451,161 |
| Grand Rapids | $419,350 | 93.2 | $449,946 |
| Lansing | $417,054 | 93.2 | $447,483 |
Adjusted salary = nominal salary × (100 / CoL index). CoL index: 100 = national average. Lower index = lower cost of living.
Salary by Experience Level in Michigan
| Experience Level | Estimated Annual |
|---|---|
| Entry Level (0-2 years) | $229,089 |
| Mid Career (3-7 years) | $390,415 |
| Experienced (7+ years) | $554,815 |
Estimates based on BLS percentile data averaged across Michigan metro areas. Individual pay varies by employer, certifications, and specialization.
All 52 Cities in Michigan
| # | City | Median Salary |
|---|---|---|
| 1 | Detroit | $441,013 |
| 2 | Clinton Township | $425,839 |
| 3 | Sterling Heights | $420,482 |
| 4 | Grand Rapids | $419,350 |
| 5 | Lansing | $417,054 |
| 6 | Battle Creek | $416,885 |
| 7 | West Bloomfield | $416,233 |
| 8 | Kalamazoo | $416,102 |
| 9 | Shelby Township | $415,287 |
| 10 | Troy | $414,406 |
| 11 | Dearborn | $413,826 |
| 12 | Westland | $413,329 |
| 13 | Wyoming | $412,775 |
| 14 | Farmington Hills | $412,449 |
| 15 | Warren | $412,362 |
| 16 | Dearborn Heights | $411,536 |
| 17 | Southfield | $410,753 |
| 18 | Macomb Township | $409,872 |
| 19 | St. Clair Shores | $409,415 |
| 20 | Rochester Hills | $409,187 |
| 21 | Bay City | $408,847 |
| 22 | Taylor | $408,046 |
| 23 | Port Huron | $406,897 |
| 24 | Royal Oak | $406,806 |
| 25 | Lincoln Park | $406,514 |
| 26 | Jackson | $406,162 |
| 27 | Saginaw | $405,874 |
| 28 | Livonia | $405,697 |
| 29 | Canton | $402,663 |
| 30 | Novi | $402,533 |
| 31 | Auburn Hills | $402,135 |
| 32 | Waterford | $401,913 |
| 33 | Muskegon | $401,400 |
| 34 | Roseville | $401,177 |
| 35 | Flint | $400,934 |
| 36 | Kentwood | $400,511 |
| 37 | Garden City | $400,382 |
| 38 | Allen Park | $397,980 |
| 39 | Pontiac | $397,705 |
| 40 | Marquette | $396,667 |
| 41 | Norton Shores | $396,573 |
| 42 | East Lansing | $396,127 |
| 43 | Inkster | $396,047 |
| 44 | Midland | $393,730 |
| 45 | Holland | $393,569 |
| 46 | Ferndale | $390,844 |
| 47 | Traverse City | $389,760 |
| 48 | Portage | $389,511 |
| 49 | Mount Pleasant | $384,186 |
| 50 | Ypsilanti | $383,070 |
| 51 | Romulus | $380,871 |
| 52 | Ann Arbor | $86,363 |
More Michigan Salary Data
Hourly Rates
Explore radiologist hourly pay in Michigan cities.
Senior / Experienced
Top earner salaries for experienced radiologists.
Compare Cities in Michigan
View all comparisons →Explore More Radiologist Salary Data
Frequently Asked Questions
How much do radiologists make in Michigan in 2026?
What is the highest paying city for radiologists in Michigan?
How does Michigan radiologist pay compare to the national average?
What is the entry-level radiologist salary in Michigan?
How many radiologists are employed in Michigan?
Which Michigan city offers the best value for radiologists?
Written by Dr. Maria Chen, MD
Career Analyst
Dr. Chen has 10 years of experience in diagnostic radiology. She specializes in imaging techniques for oncology. She works at a regional medical center.
Methodology & Data Source
Statewide salary figures on this page are 2026 projections based on the Bureau of Labor Statistics Occupational Employment and Wage Statistics (OEWS) survey, May 2026 release. A 5.00% compound annual growth rate (CAGR), derived from 6-year national BLS wage trends, was applied to each metro area's reported salary to estimate current 2026 radiologist compensation across Michigan. State averages are employment-weighted across 52 metro areas — larger metro areas with more radiologistscontribute proportionally more to the average, producing figures that better reflect typical compensation. Individual pay varies by city, employer, certifications, and experience.
Data Sources & Methodology
Source: BLS, OEWS, 3-year dataset (–). Per-city data from annual BLS metropolitan area surveys.
2026 figures are projected from 2025 BLS data using a compound annual growth rate (CAGR) of 5.00%, derived from historical BLS wage trends for radiologists (SOC 29-1224).
Compiled and verified by Dr. Maria Chen, MD, a licensed radiologist with 10+ years of clinical experience. · View source data at BLS.gov