Radiologist Salary in Washington: $478,611 (2026)
Quick Answer:Across Washington's 49 metropolitan areas, the average median radiologist pay sits at $478,611/year heading into 2026 — a figure projected from 2025 BLS OEWS wage data for SOC 29-1224. Because Washington sits at BEA RPP 107.4 (7% above the U.S. baseline), that statewide median translates to roughly $445,634 in nationally-comparable purchasing power. Highest-paying metros: Seattle ($497,674), Renton ($463,810), Bellevue ($460,998).
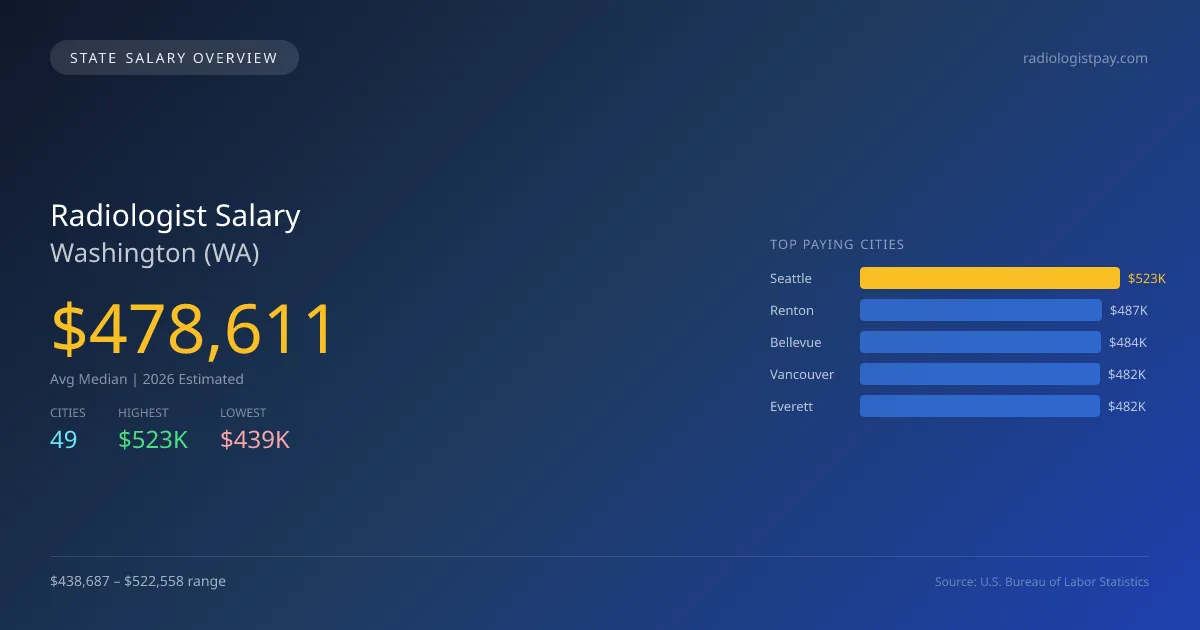
In 2026, the average median salary for radiologists in Washington is projected to be $478,611, which is 8.3% higher than the national median of $441,903. This reflects Washington's strong demand for radiologists, with a total of 719 professionals working across the state. Seattle stands out with the highest salary at $522,558, while Tukwila offers the lowest at $438,687. The substantial salary difference between the highest and lowest paying cities can be attributed to factors such as local cost of living, demand for specialized medical imaging services, and the concentration of healthcare facilities in urban areas. Obtaining a radiology license in Washington requires adherence to specific state regulations, and the scope of practice laws may influence job responsibilities. The state's ongoing population growth and advances in healthcare technology are likely drivers of demand for radiological services, leading to a projected annual growth rate of 5.00%. Washington's job market for radiologists appears strong, making it an appealing destination for those considering this career path. Notable cities for radiologists include Renton at $487,001, Bellevue at $484,048, Vancouver at $482,437, and Everett at $482,284, showcasing a range of attractive salary options throughout the state.
Washington Radiologist Salary Range
Overall salary range in Washington: $113,222 (lowest entry-level) to $756,117 (highest top earner)
Washington vs National Average
Washington radiologists earn 8.31% more than the national median (+$36,708/year difference).
Washington Radiologist Salary Distribution (2026)
Radiologist salaries in Washington range from $277,594 (entry-level, 10th percentile) to $684,641 (top earners, 90th percentile), with a median of $478,611. The Washington median is $36,708 above the US national median of $441,903. The average hourly rate is $230.10/hr. Approximately 719 radiologists are employed across 49 cities.
2021 BLS Actual
$375,004
2025 BLS Actual
$455,820
2026 Current Est.
$478,611
2021–2027 Growth
+34.0%
Salary Trajectory for Radiologists in Washington (2021–2027)
2021–2025: actual BLS OEWS data for this metro area. 2026+: CAGR 5.00% projection.
| Year | Annual Salary | Status |
|---|---|---|
| 2021 | $375,004 | Actual |
| 2022 | $393,755 | Actual |
| 2023 | $413,442 | Actual |
| 2024 | $444,931 | Actual |
| 2025 | $455,820 | Actual |
| 2026(current) | $478,611 | Estimated |
| 2027 | $502,542 | Projected |
Based on 5 years of BLS OEWS data for the Washington metropolitan area, the median radiologist salary grew 21.6% from $375,004 (2021) to $455,820 (2025). At a 5.00% compound annual growth rate, salaries are projected to reach $502,542 by 2027 — a total increase of $127,538 (34.01%) from 2021.
Note: Historical values (2021–2025) are actual BLS OEWS figures for the Washington metropolitan area, sourced from annual Occupational Employment and Wage Statistics surveys. 2026–2026 figures are current estimates, and 2027 values are projections, calculated using a 5.00% CAGR derived from 5-year BLS historical data. Actual salaries may vary based on employer, experience, certifications, and local market conditions.
Top 5 Highest Paying Cities in Washington
Lowest Paying Cities in Washington
| City | Median Salary |
|---|---|
| Tukwila | $438,687 |
| Mountlake Terrace | $439,365 |
| Covington | $445,539 |
| Kenmore | $445,575 |
| Oak Harbor | $448,466 |
Best Value Cities for Radiologists in Washington
When adjusted for local cost of living, these Washington cities offer the most purchasing power for radiologists.
| City | Nominal Salary | CoL Index | Adjusted Salary |
|---|---|---|---|
| Seattle | $522,558 | 107.4 | $486,553 |
| Renton | $487,001 | 107.4 | $453,446 |
| Bellevue | $484,048 | 107.4 | $450,696 |
| Spokane | $452,130 | 100.346 | $450,571 |
| Vancouver | $482,437 | 107.4 | $449,196 |
Adjusted salary = nominal salary × (100 / CoL index). CoL index: 100 = national average. Lower index = lower cost of living.
Salary by Experience Level in Washington
| Experience Level | Estimated Annual |
|---|---|
| Entry Level (0-2 years) | $277,594 |
| Mid Career (3-7 years) | $478,611 |
| Experienced (7+ years) | $684,641 |
Estimates based on BLS percentile data averaged across Washington metro areas. Individual pay varies by employer, certifications, and specialization.
All 49 Cities in Washington
| # | City | Median Salary |
|---|---|---|
| 1 | Seattle | $522,558 |
| 2 | Renton | $487,001 |
| 3 | Bellevue | $484,048 |
| 4 | Vancouver | $482,437 |
| 5 | Everett | $482,284 |
| 6 | Tacoma | $480,689 |
| 7 | Richland | $479,651 |
| 8 | Marysville | $478,673 |
| 9 | Shoreline | $476,042 |
| 10 | Bellingham | $474,200 |
| 11 | Redmond | $474,162 |
| 12 | Kent | $473,771 |
| 13 | Kirkland | $472,997 |
| 14 | Burien | $472,395 |
| 15 | Kennewick | $470,855 |
| 16 | Federal Way | $470,319 |
| 17 | Des Moines | $470,218 |
| 18 | Olympia | $470,084 |
| 19 | Auburn | $469,125 |
| 20 | Lakewood | $468,937 |
| 21 | Issaquah | $468,671 |
| 22 | Lacey | $466,006 |
| 23 | Sammamish | $465,592 |
| 24 | University Place | $465,430 |
| 25 | SeaTac | $465,062 |
| 26 | Tumwater | $464,583 |
| 27 | Pasco | $463,073 |
| 28 | Longview | $462,852 |
| 29 | Mount Vernon | $461,673 |
| 30 | Spokane Valley | $460,829 |
| 31 | Edmonds | $460,237 |
| 32 | Lake Stevens | $459,022 |
| 33 | Lynnwood | $458,727 |
| 34 | Moses Lake | $457,843 |
| 35 | Bothell | $457,512 |
| 36 | Pullman | $455,486 |
| 37 | Puyallup | $454,455 |
| 38 | Ellensburg | $452,748 |
| 39 | Spokane | $452,130 |
| 40 | Maple Valley | $451,508 |
| 41 | Bremerton | $451,030 |
| 42 | Walla Walla | $450,514 |
| 43 | Camas | $450,367 |
| 44 | Wenatchee | $449,999 |
| 45 | Oak Harbor | $448,466 |
| 46 | Kenmore | $445,575 |
| 47 | Covington | $445,539 |
| 48 | Mountlake Terrace | $439,365 |
| 49 | Tukwila | $438,687 |
More Washington Salary Data
Compare Cities in Washington
View all comparisons →Explore More Radiologist Salary Data
Frequently Asked Questions
How much do radiologists make in Washington in 2026?
What is the highest paying city for radiologists in Washington?
How does Washington radiologist pay compare to the national average?
What is the entry-level radiologist salary in Washington?
How many radiologists are employed in Washington?
Which Washington city offers the best value for radiologists?
Written by Dr. Maria Chen, MD
Career Analyst
Dr. Chen has 10 years of experience in diagnostic radiology. She specializes in imaging techniques for oncology. She works at a regional medical center.
Methodology & Data Source
Statewide salary figures on this page are 2026 projections based on the Bureau of Labor Statistics Occupational Employment and Wage Statistics (OEWS) survey, May 2026 release. A 5.00% compound annual growth rate (CAGR), derived from 6-year national BLS wage trends, was applied to each metro area's reported salary to estimate current 2026 radiologist compensation across Washington. State averages are employment-weighted across 49 metro areas — larger metro areas with more radiologistscontribute proportionally more to the average, producing figures that better reflect typical compensation. Individual pay varies by city, employer, certifications, and experience.
Data Sources & Methodology
Source: BLS, OEWS, 2-year dataset (–). Per-city data from annual BLS metropolitan area surveys.
2026 figures are projected from 2025 BLS data using a compound annual growth rate (CAGR) of 5.00%, derived from historical BLS wage trends for radiologists (SOC 29-1224).
Compiled and verified by Dr. Maria Chen, MD, a licensed radiologist with 10+ years of clinical experience. · View source data at BLS.gov